
Restaurant Data Reports
Operation Wrapped
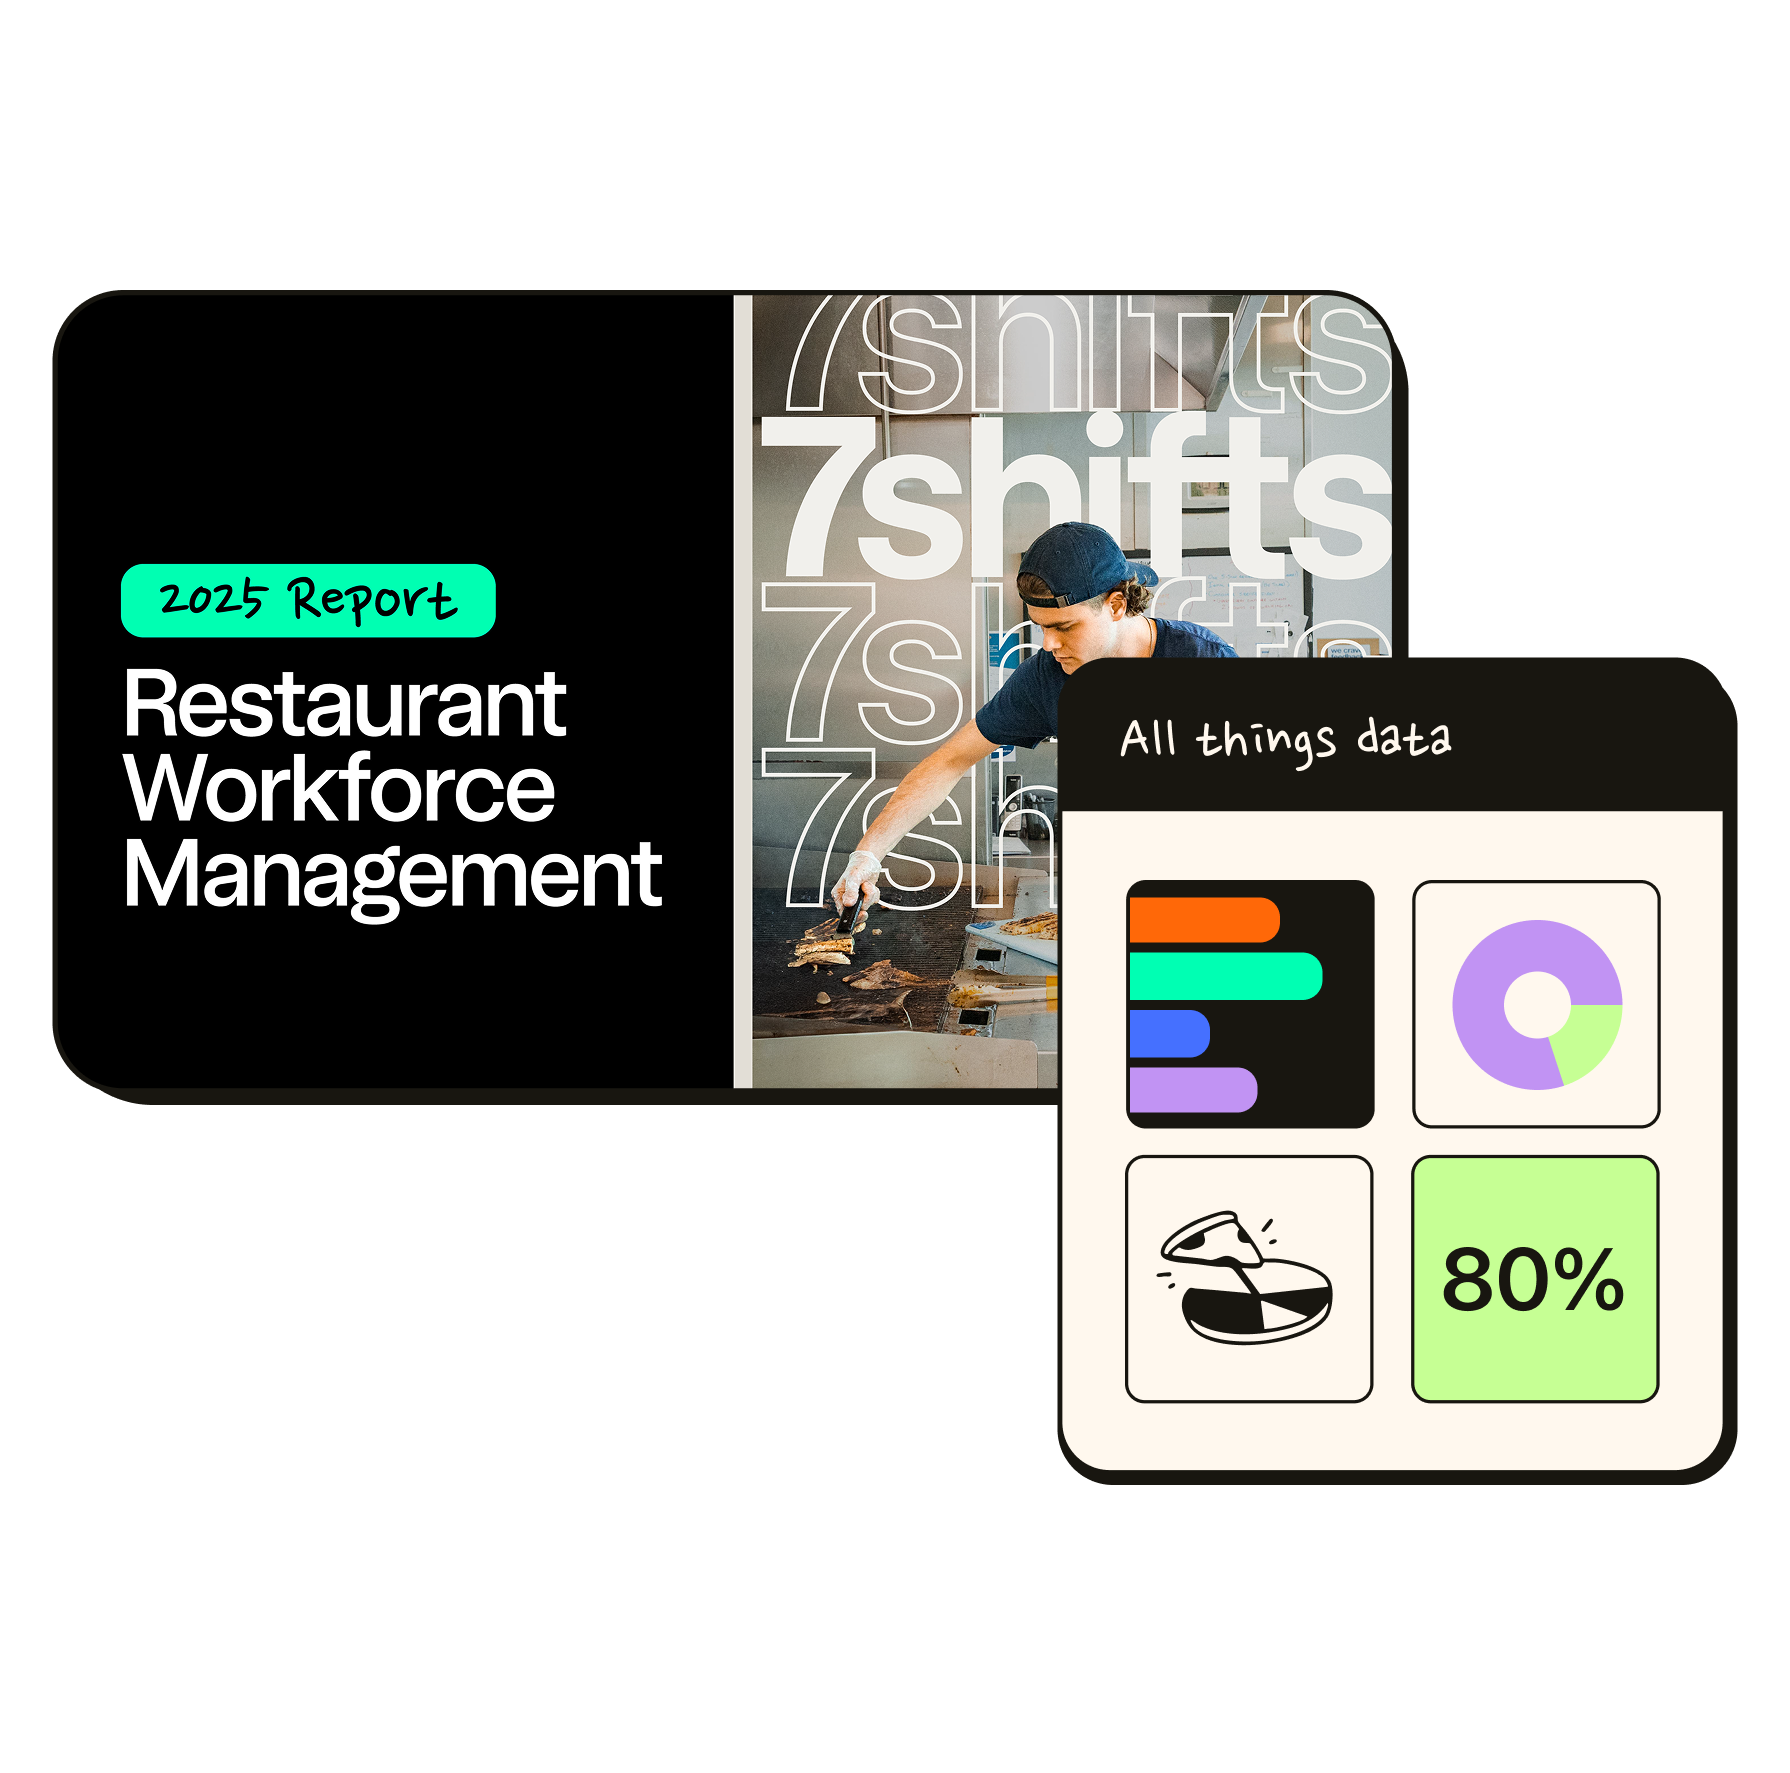
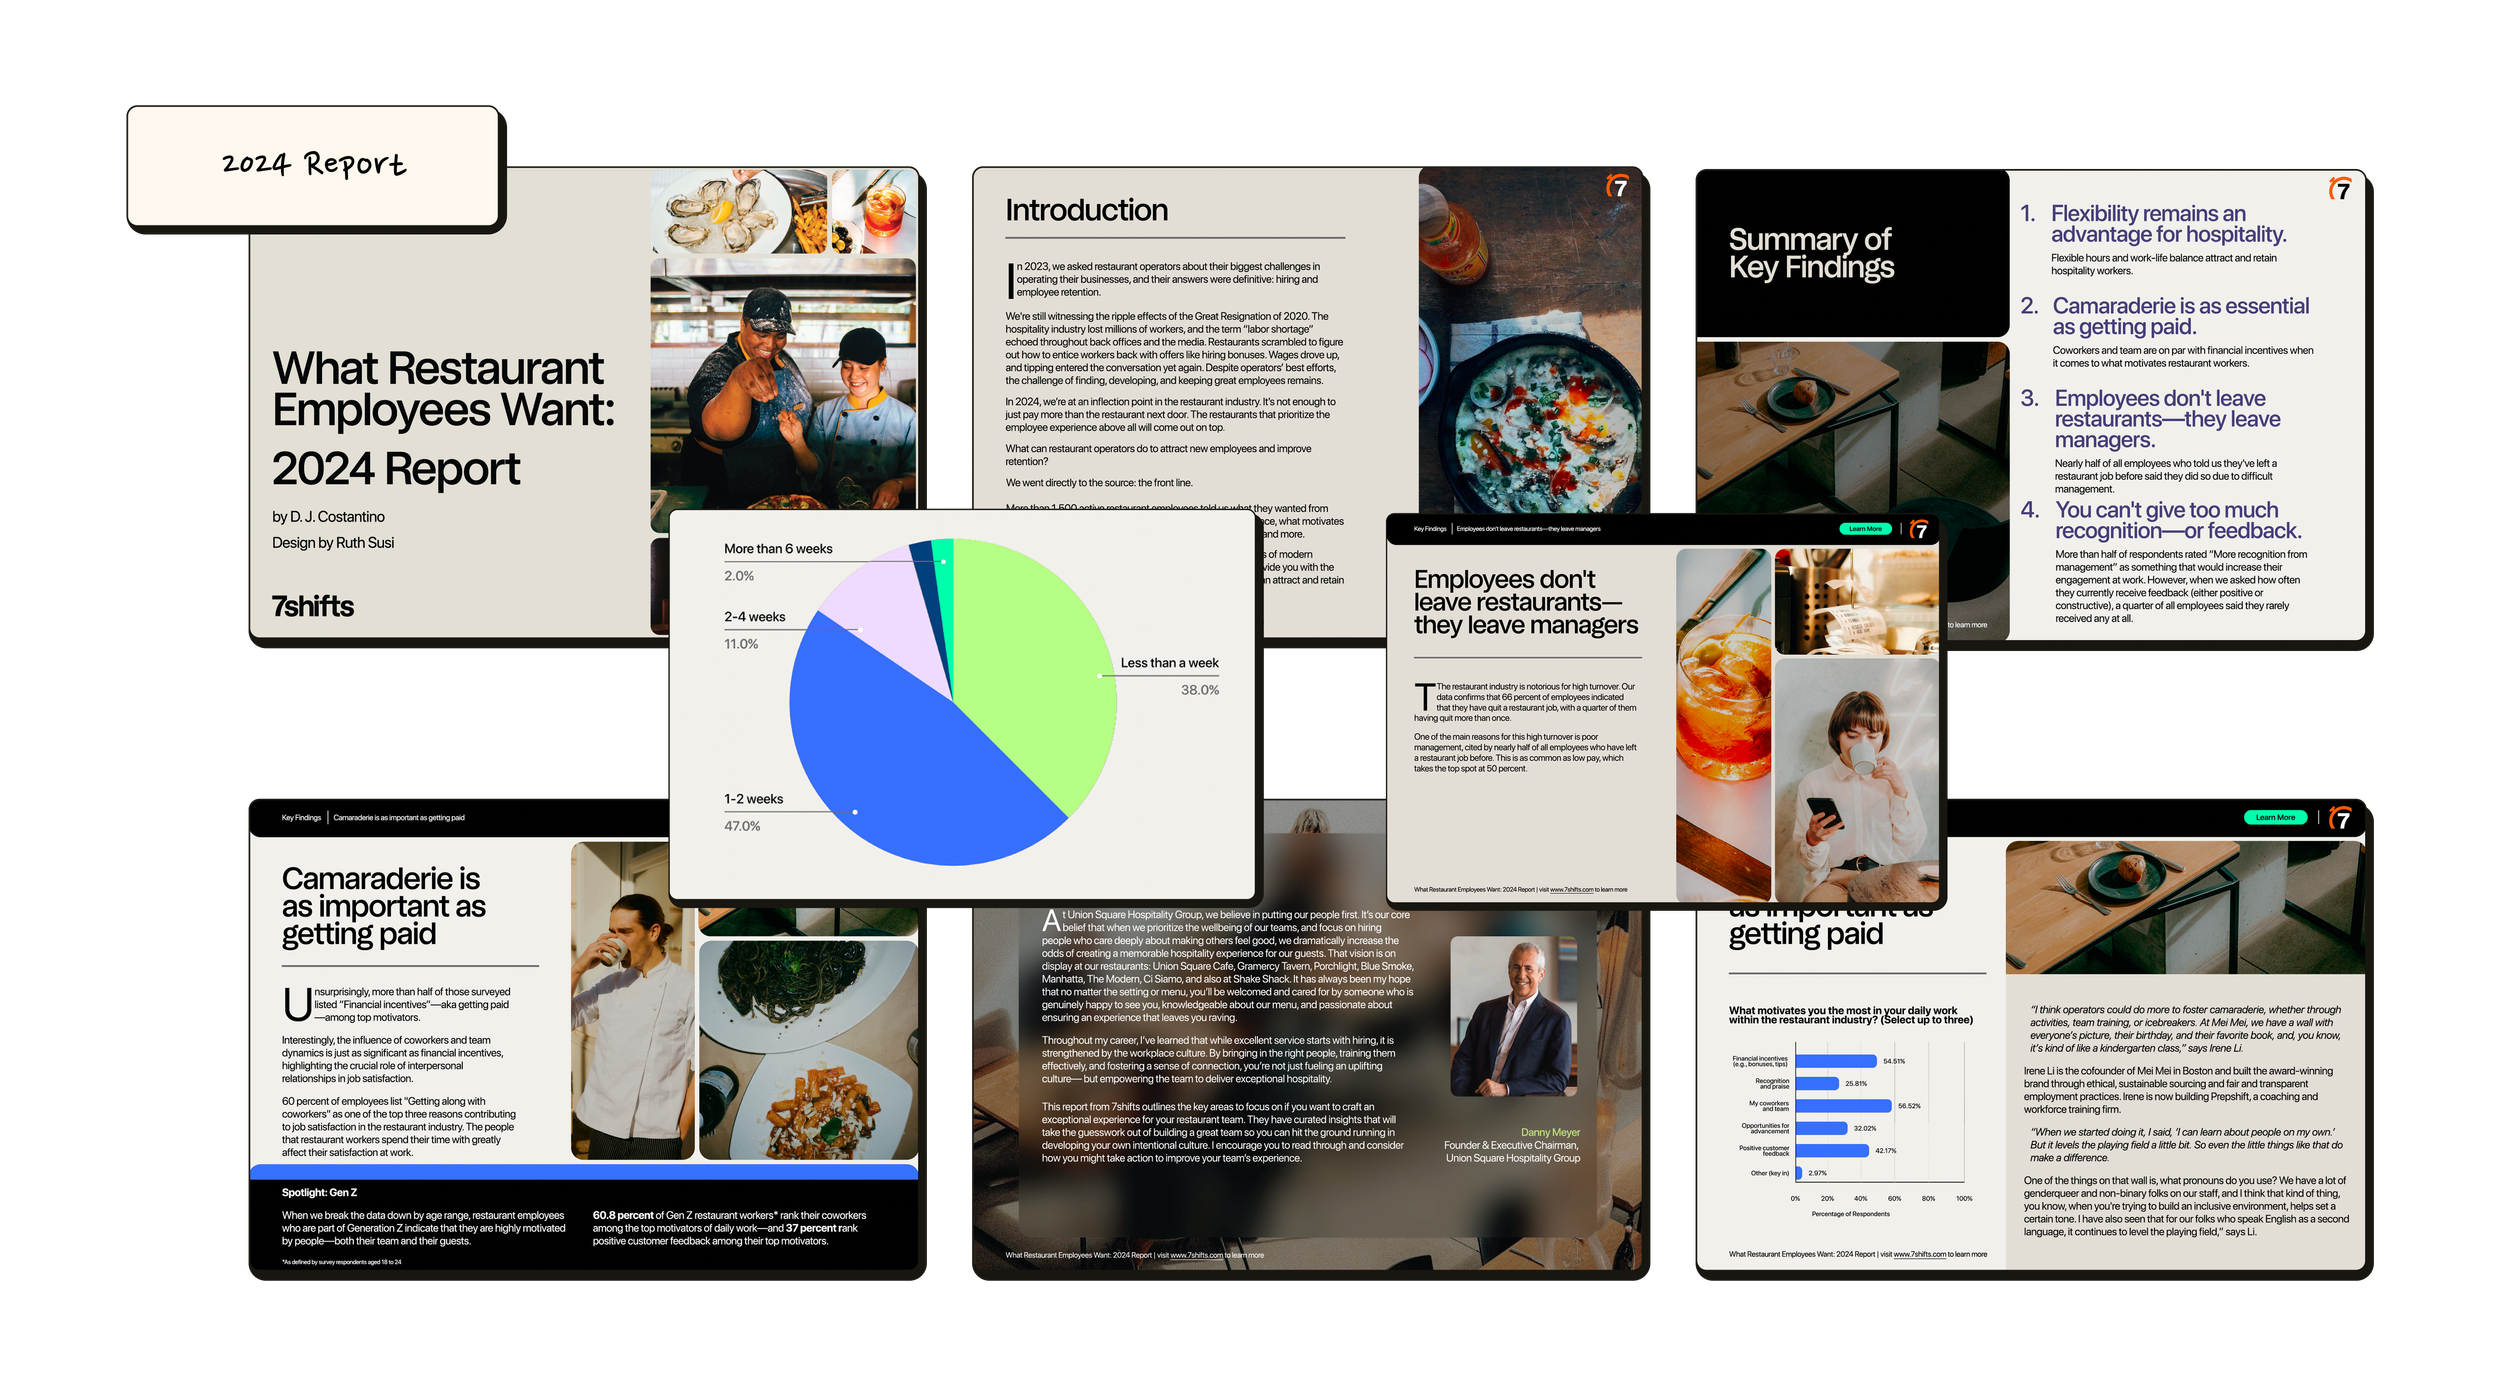
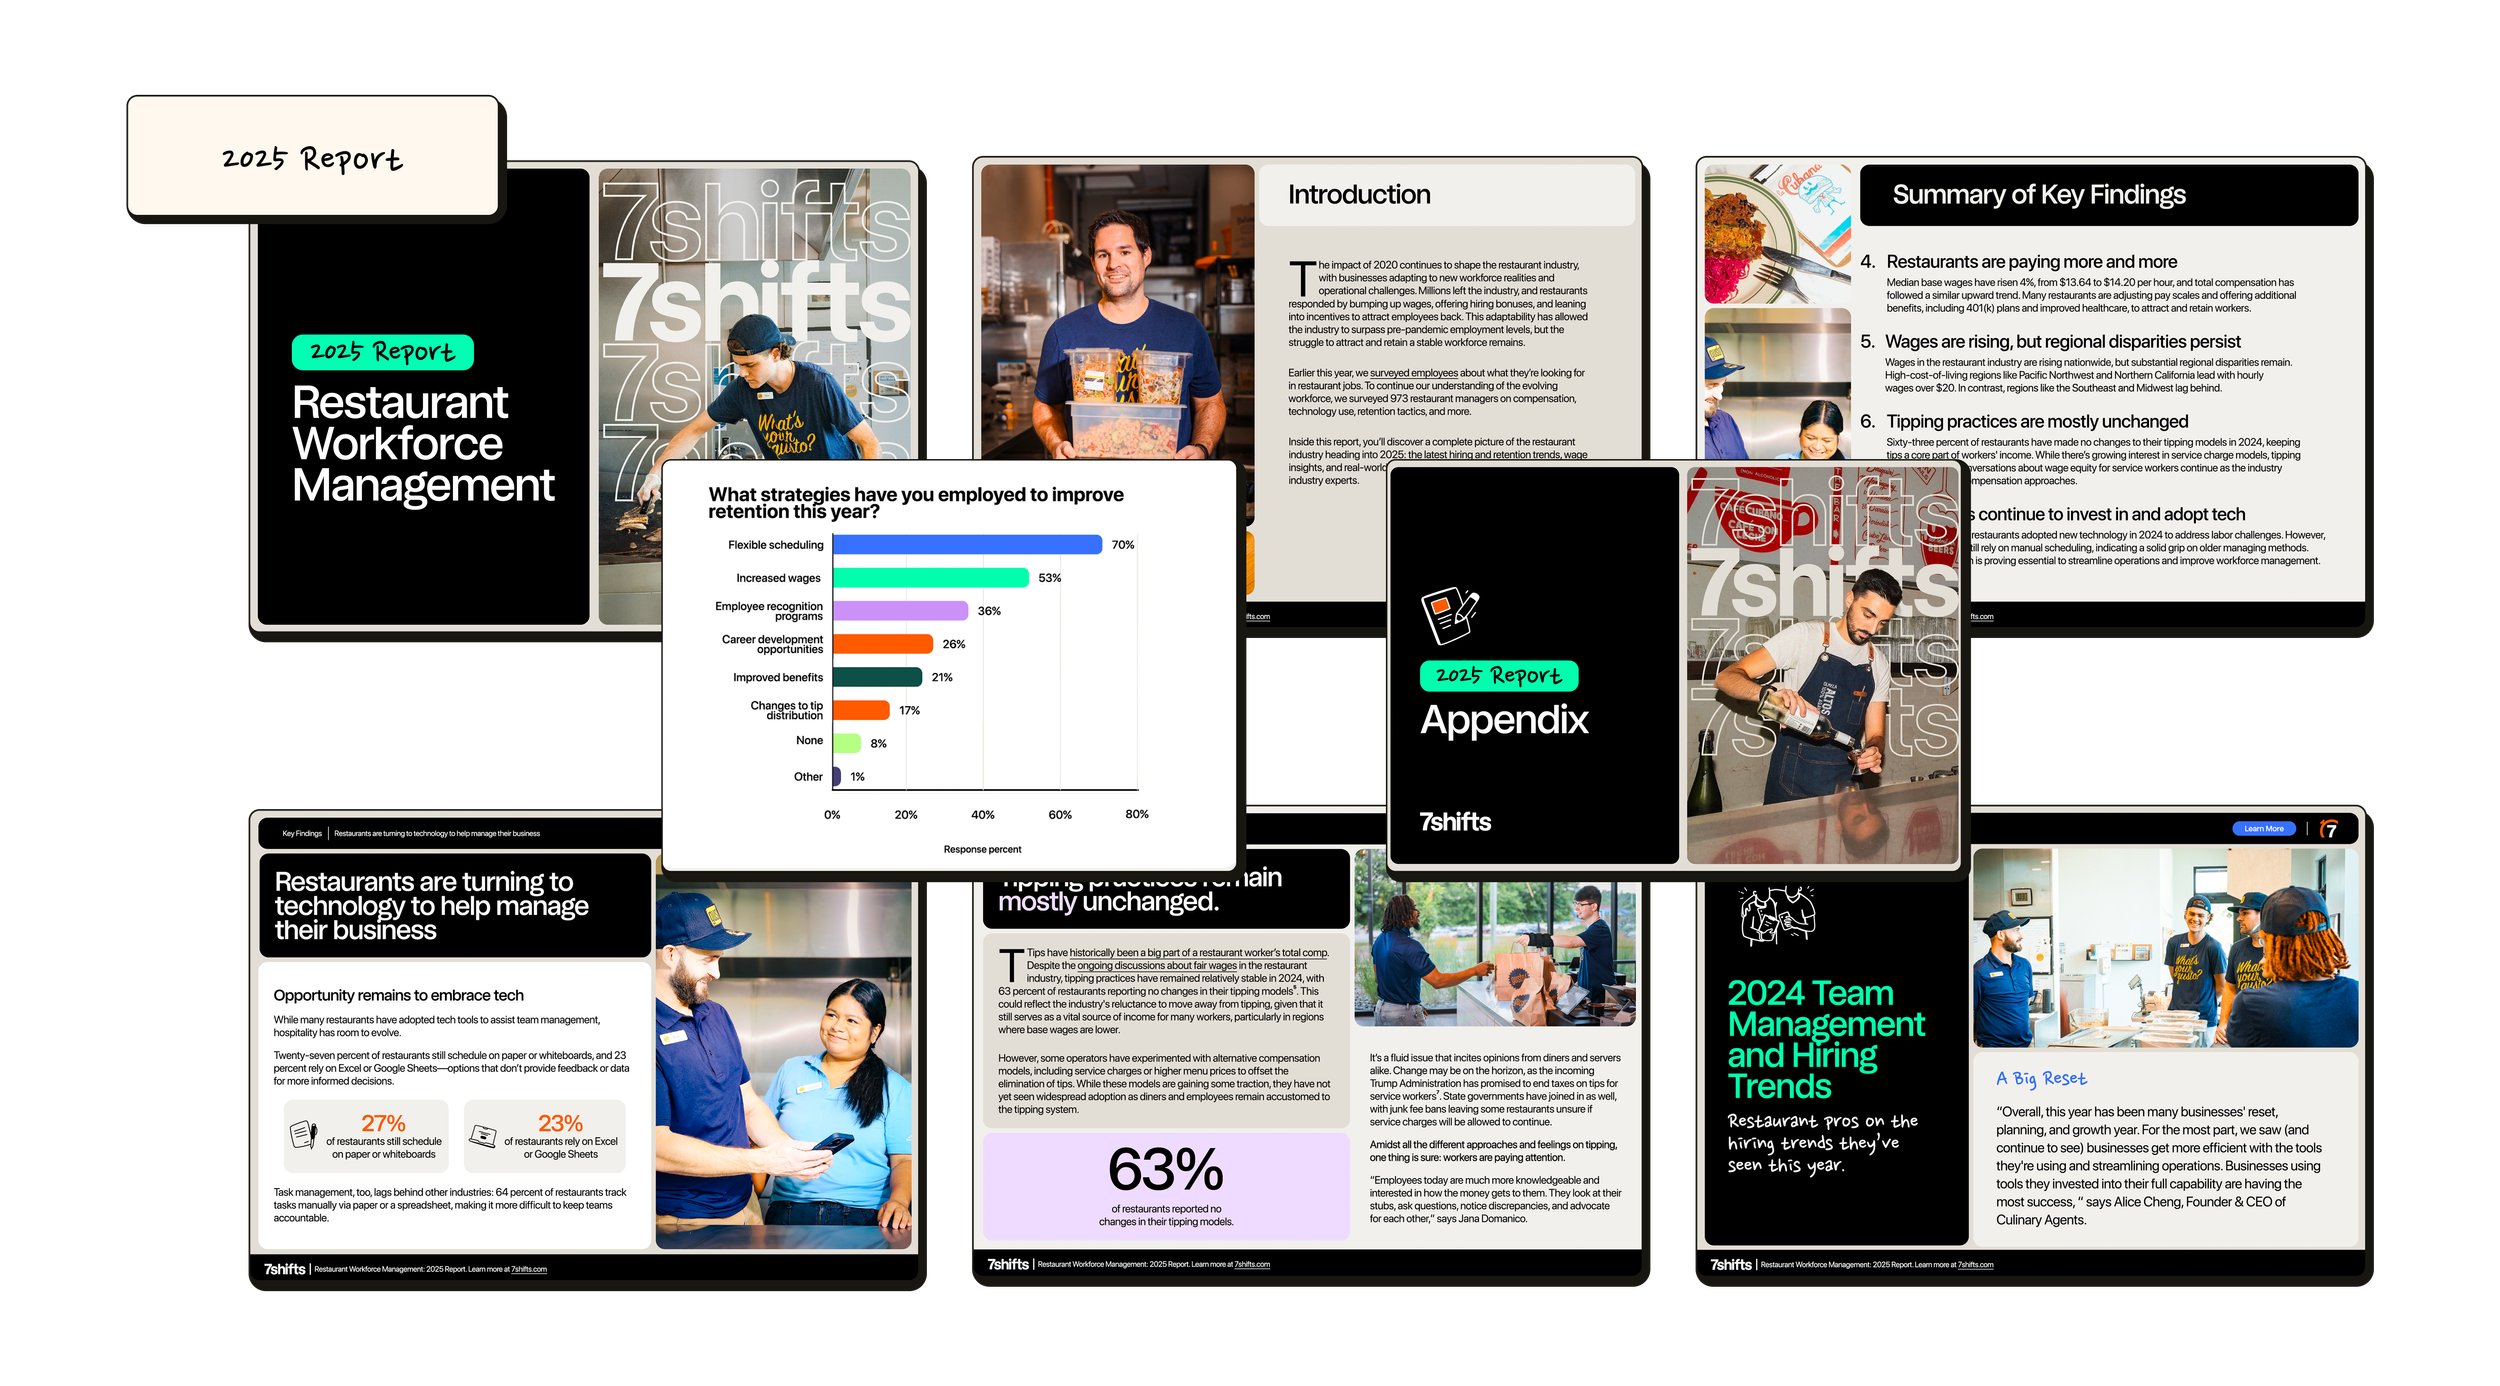
In 2024 and 2025, I worked on two major data reports for 7shifts that aimed to surface insights from thousands of restaurant workers and operators across North America. These reports: the Restaurant Employee Engagement Report and the Restaurant Workforce Report were created to give our audience a clearer picture of industry trends, challenges, and opportunities. I led the design of both PDF reports, focusing on translating complex data into clear, meaningful visuals and layouts that felt approachable and on-brand. These were paired with custom-built landing pages, where I provided design support to ensure the storytelling remained consistent from page to product.
2024 Report: Landing page & download full report here
2025 Report: Landing page & download full report here
Data Report Pages
Project Scope
I led the design of two major industry reports at 7shifts: the 2024 Restaurant Employee Engagement Report and the 2025 Restaurant Workforce Report. My role was to transform raw survey data into a clean, story-driven layout that made complex insights easy to understand. Using Figma, I built out the full PDF reports, designing charts, graphs, and page flows that aligned with our brand and spoke directly to restaurant operators. I also supported the design of each report’s landing page, built in Framer, to ensure a smooth and cohesive experience from first click to final download.
Bringing Restaurant Industry Insights to Life
Both reports became key content pieces for 7shifts, shared widely in marketing campaigns, social channels, and press. The final designs helped bring structure and clarity to industry data, giving restaurant teams something they could actually use.
These reports positioned 7shifts as a trusted voice in the space, while giving the marketing team tools to start stronger conversations with our audience.
Tools and Collaboration
Figma and Framer
Collaborated with Design & Copy Team
My Role
Design lead for print
Design support for landing pages
Deliverables
Full Report PDFs (2024 & 2025)
Framer Landing Pages
Design support for page structure, visual styling, and responsiveness
Alignment with PDF visuals for brand continuity
Marketing Ads for Report Promotion
Static and animated social media graphics (Instagram, LinkedIn, etc.) designed to highlight key stats and encourage report downloads
Optimized for engagement across organic and paid campaigns